eBook
Checklist to Unleash Seamless Collaboration & Boost Bottom Lines with Vantage DX
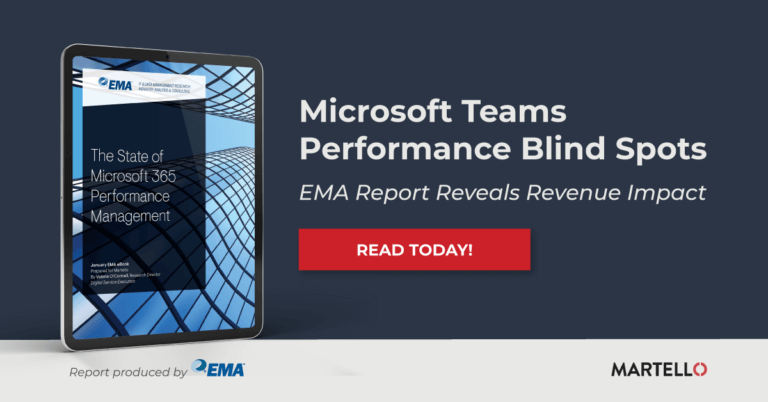
When glitchy Microsoft Teams performance hits your revenue-generating team it hits your bottom line if they struggle to close business.
Download eBook
When glitchy Microsoft Teams performance hits your revenue-generating team it hits your bottom line if they struggle to close business.
Download eBook


Sorry, there are no eBooks that meet your criteria.