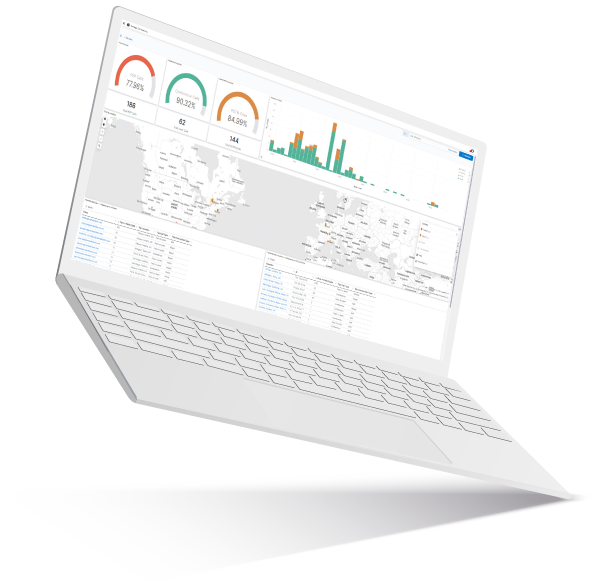

24/7 User Experience and Performance Monitoring
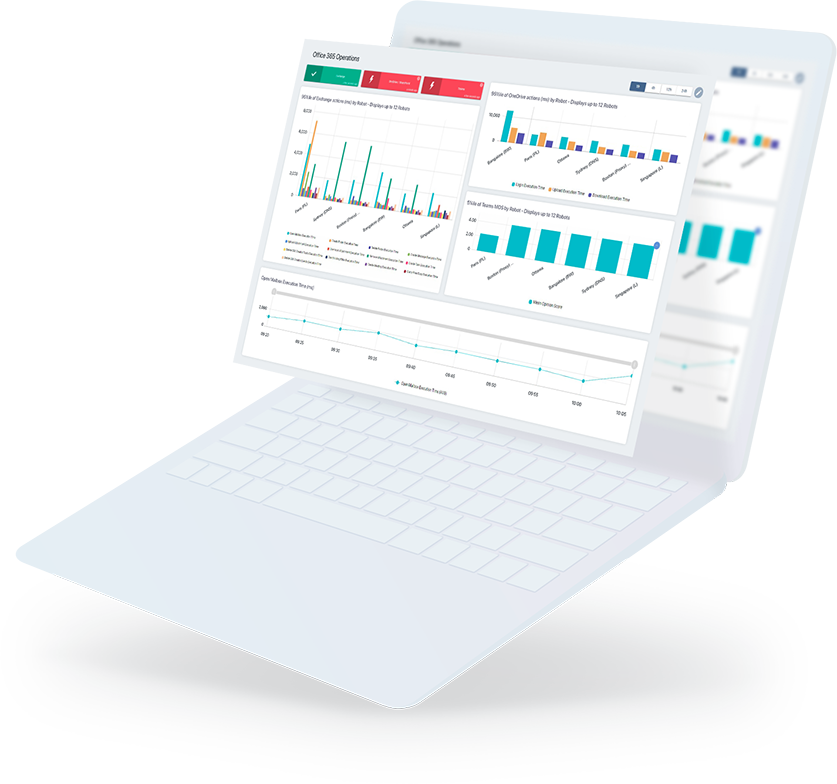
- Tests the critical features of Office 365 as a user would. It can then detect any Microsoft 365 service issues from all critical sites.
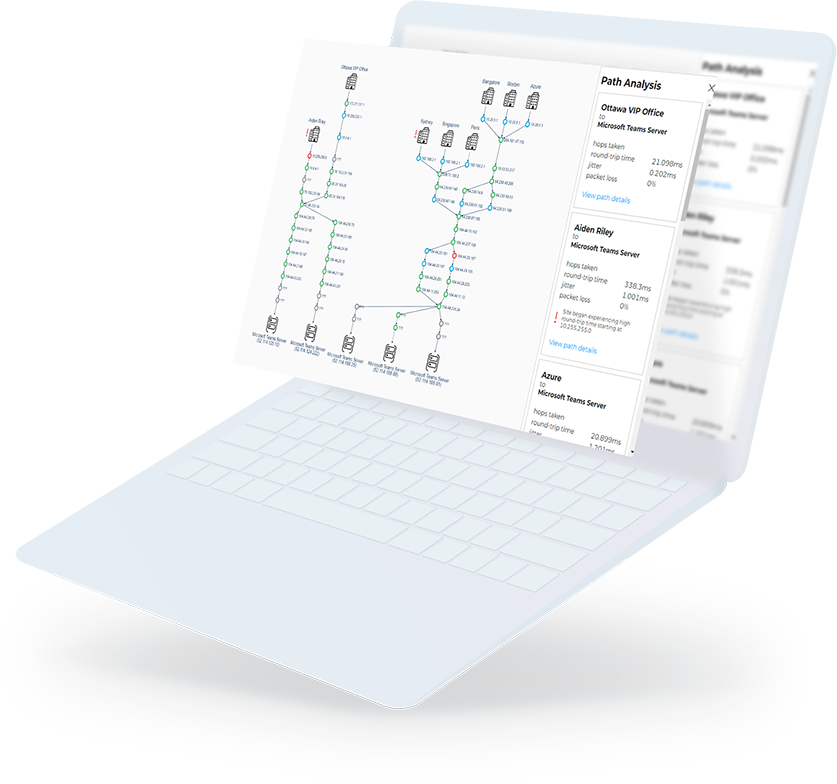
- Proactively alert on Office 365 outages and Teams calls quality issues, with actionable data.
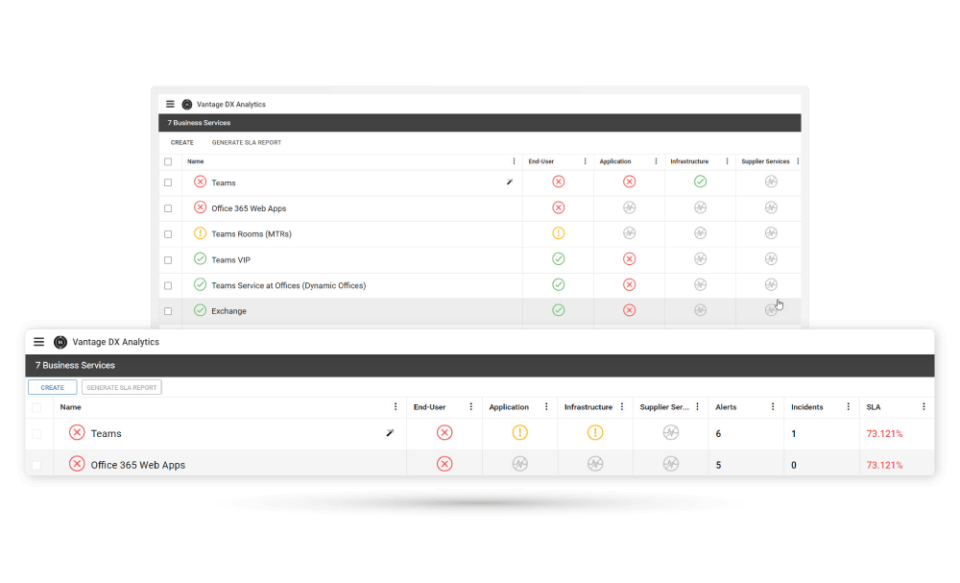
- Synchronize user experience alerts with your ITSM tools such as ServiceNow.